Customer satisfaction, loyalty
and willingness to recommend.
A complete B2B customer survey combines NPS measurement, customer satisfaction index (CSI) and qualitative depth analysis — tailored per market, region and customer category. A strategic metric with direct linkage to churn, loyalty and profitability.
Typical ROI on an NPS study through identified churn risks and cross-sell opportunities.
Of customer churn is signalled 6 months in advance in a structured NPS measurement.
Industry benchmarks from Alba's (formerly TradeWell Group) historical studies since 2005.
What a segmented NPS analysis looks like
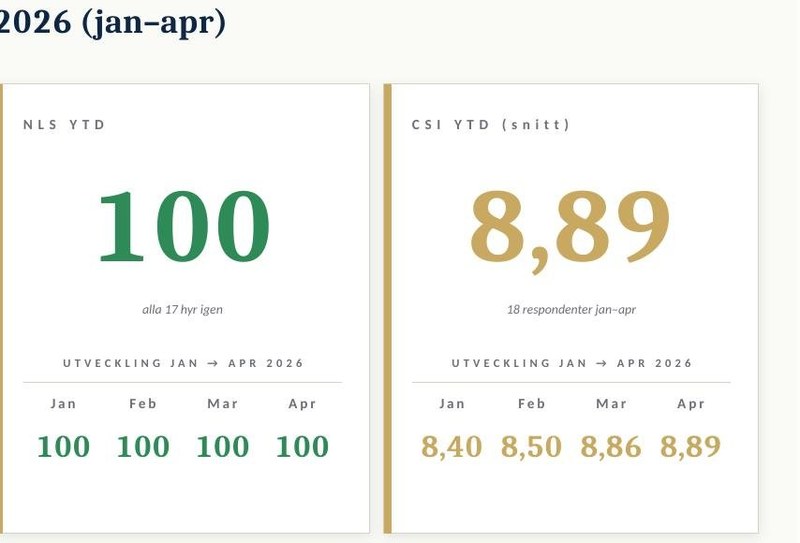
YTD dashboard with NPS, NLS and CSI per month — broken down per subsidiary and salesperson. This is an actual delivery to a B2B manufacturer (anonymised).
A complete picture
of the customer relationship
We always start by understanding your business goals — then we choose method and design. The result is not just numbers but concrete action recommendations ranked by expected impact.
NPS per segment
Granular NPS data. Mapping per market, region and customer category — so you know exactly where you have loyalty problems and where you have strength to defend. Not just a single overall average.
Correlation analysis
Which questions drive NPS? Statistical weighting of every question's impact on the total NPS result. Identifies the most critical improvement areas — the ones to prioritise first.
Management summary
Concrete actions — not reports. A 1-page executive summary plus a prioritised action list per business area. Hand-written and packaged for decisions, not for archiving.
Longitudinal measurement
Comparable over time. Same methodology year after year — so improvements and declines are visible. Option for ongoing NPS tracking or annual deep study. We help you keep the measurement consistent.
NPS guide for B2B
The complete NPS guide for B2B
A 25-minute read written by Johan Asklund. Step-by-step on how to implement, measure and act on NPS in a B2B context — with examples from real customer projects and concrete template questions you can use straight away.
Read the guide →Overall satisfaction, loyalty
and every phase of the customer journey
A customer survey is not a single metric. We measure both overall satisfaction and how the customer experiences every concrete touchpoint — so you know not only whether there is a problem but where it is and what it leads to.
Satisfaction per touchpoint
We measure how the customer experiences every phase — from the first requirement dialogue to post-purchase contact. Per phase, per sales team and per region. Adapted to your business model.
Three KPIs that measure the customer relationship
Standardised key figures — comparable over time and against external benchmarks. Complement to the phase ratings above.
Concrete — not just an average score
For every phase where the rating drops — or where a customer explicitly raises a frustration — you get:
Direct, anonymised customer quotes that describe the issue — making it concrete for the sales team and management.
Which actions deliver the largest lift in NPS/CSI? Correlation analysis between phase ratings and overall satisfaction.
Customers signalling churn risk are identified directly in the report — for individual follow-up.
Per identified issue: concrete proposal, owner and estimated time horizon. For decisions, not for filing.
Examples from an actual report
Screenshots from an NPS delivery to a B2B manufacturer (anonymised). Every report contains an executive summary, KPI trends, dashboard and conclusions with concrete actions. Delivered as Word + PDF + PowerPoint.
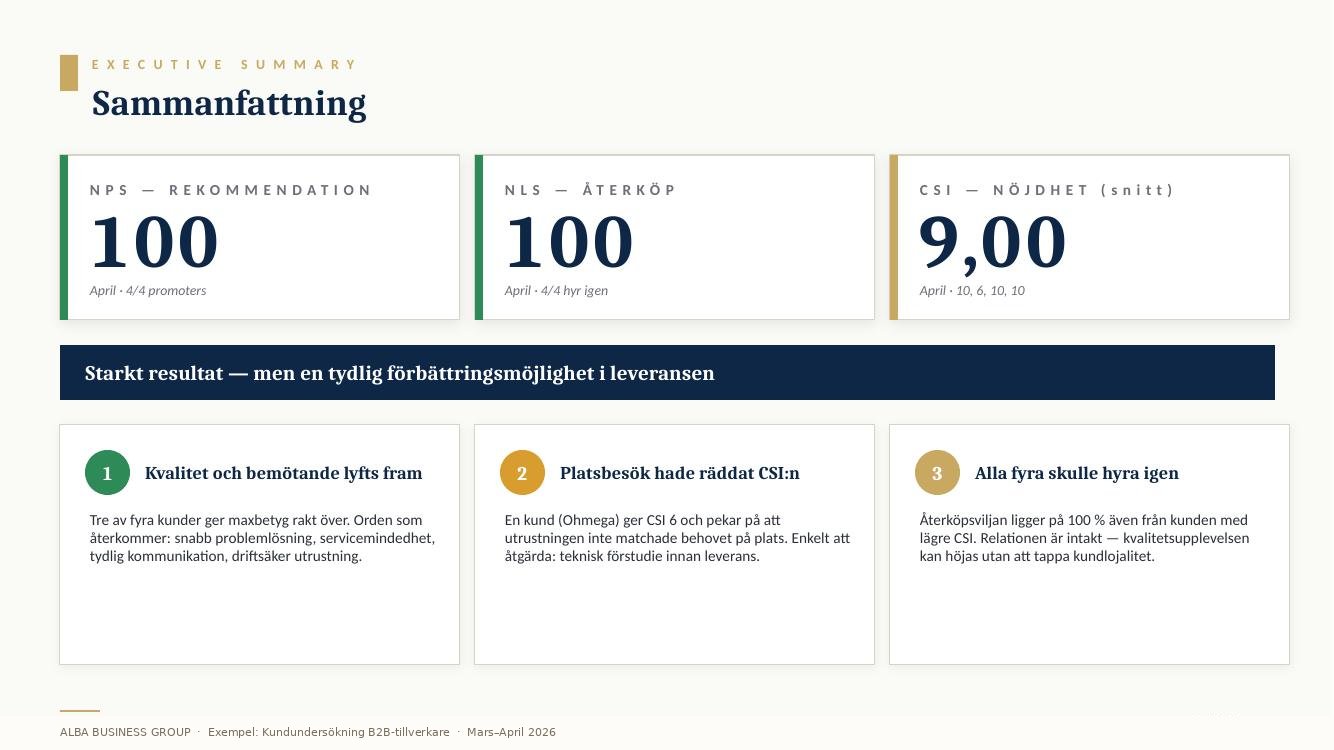
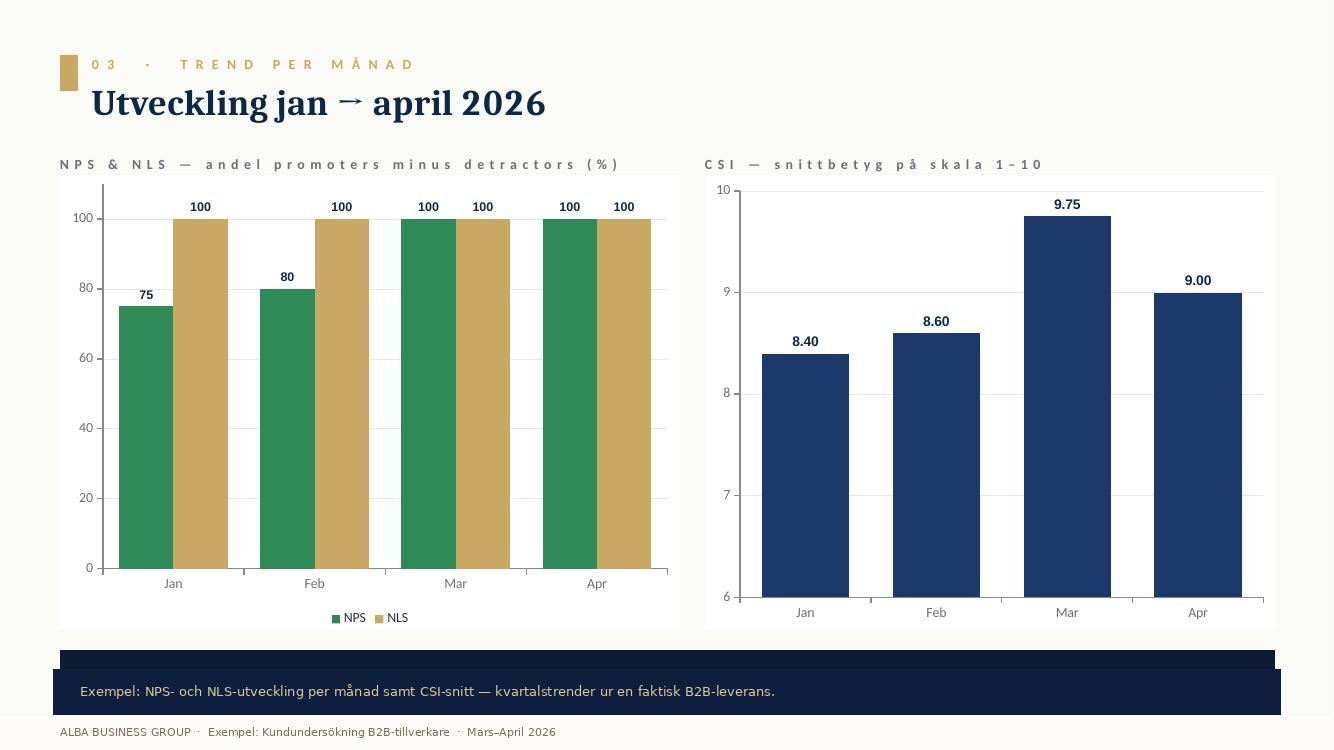
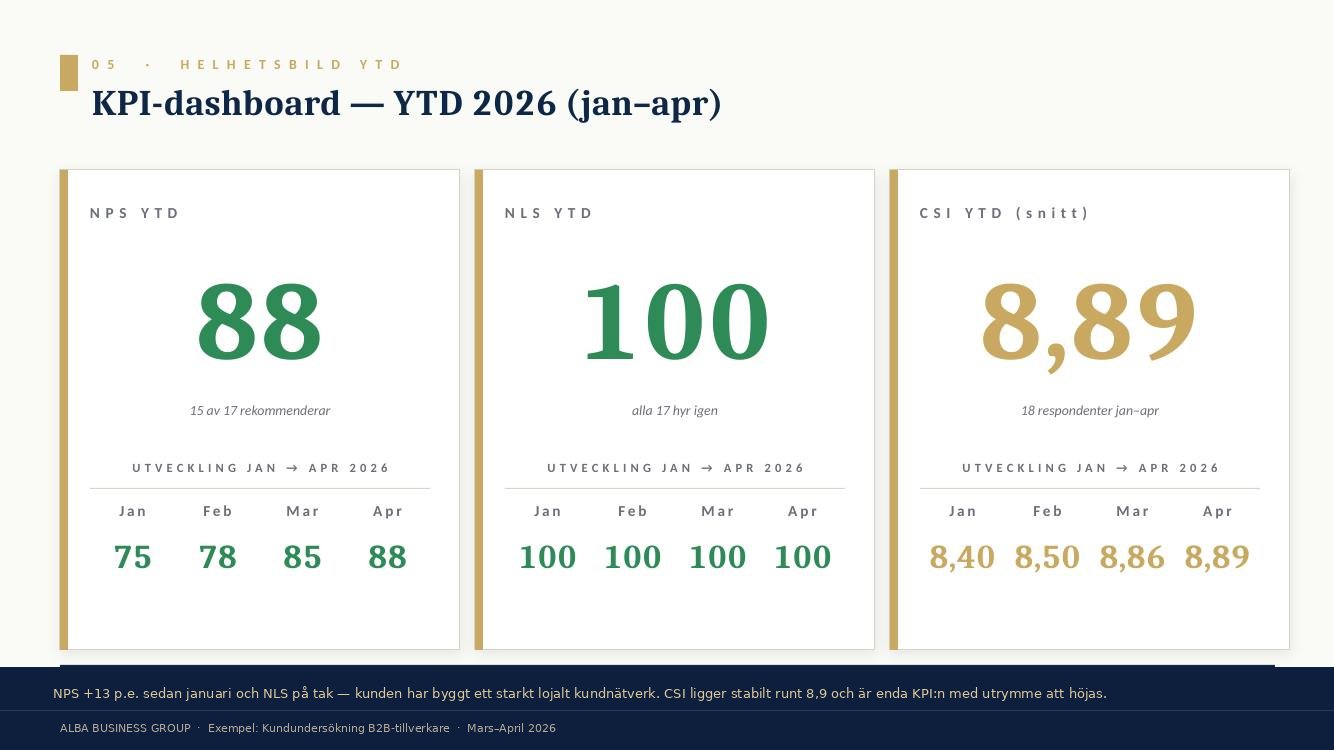
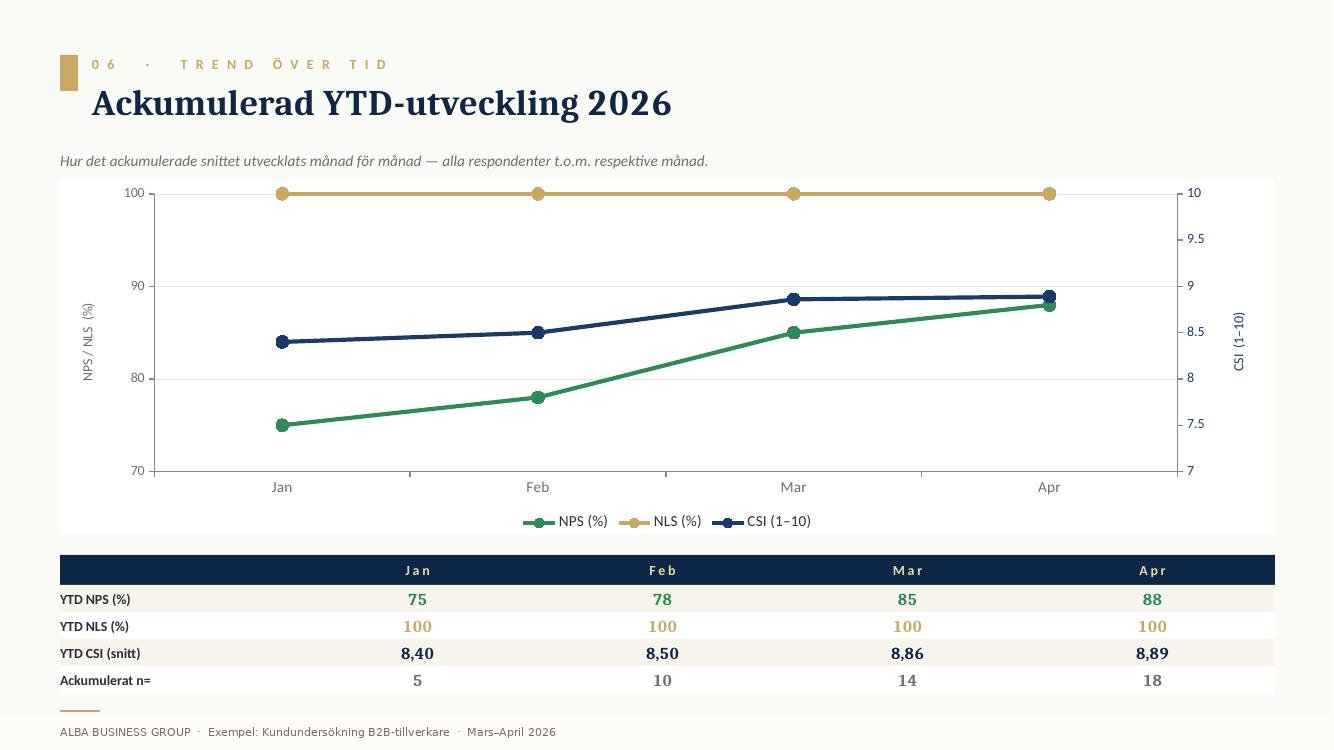
The images are from an actual delivery to a B2B manufacturer in March–April 2026. Customer name, brand and respondent data have been removed or masked in the example.

"We knew our customers were satisfied — we did not know where it started to slip. Alba's NPS study pinpointed exactly which subsidiary had the highest churn risk, and which customers we needed to call the following week."
How strong is your customer relationship
— and where is it weakest?
Book 15 minutes and we will go through your current customer-contact data and what an NPS study would tell you about churn risk over the next 12 months.
15 min · free of charge · no preparation needed