What customers
actually experience.
Identify strengths and improvement areas across the entire customer journey — from greeting and environment to service and communication, offline and online. Phase by phase, channel by channel, with concrete action proposals.
Customers with an excellent experience are 6× more likely to stay and recommend.
Of customers will gladly pay more for a better customer experience — yet few companies price it deliberately.
We rank improvement areas by expected impact on NPS — not 50 observations, but a top-10 to act on.
What a customer journey map looks like
Every touchpoint scored + a ranked action list by impact on NPS. With quotes and concrete improvement proposals per identified friction point. Actual delivery (anonymised).
A complete picture
of the customer experience
We always start by understanding your business goals — then we choose method and design. The result is not just numbers but concrete action recommendations ranked by expected impact.
Service & greeting
How is the staff perceived? Tone, expertise, willingness to help, time invested. Per staff category, store or region — so you can see where you have "service champions" and where you need training.
Environment & atmosphere
Strengthens or weakens the experience? Store/restaurant environment: hygiene, sound, lighting, scent, navigability. Online: speed, mobile experience, navigation. We map what is dragging the experience down — without you noticing.
Communication & clarity
Is the message consistent? Across channels — web, store, receipt, email, social media. Between promise and delivery. Identifies where the consumer encounters contradictions or unexpected information.
Concrete improvement areas
Not 50 observations — 10 prioritised actions. Ranked by impact on customer satisfaction and NPS. Per phase in the journey, with owner and time budget specified. For decisions, not for filing.
guide to
customer experience
The complete guide to customer experience
A 20-minute read written by Johan Asklund. How to map the customer journey touchpoint by touchpoint, measure CSI/NPS/CES, and translate friction points into prioritised actions. Mystery-shopper checklists and customer journey maps included.
Read the guide →The whole customer journey
— phase by phase
Customer experience is the sum of all touchpoints. We measure every phase of the journey, from first impression to post-purchase, and identify where the experience holds and where it slips.
Measurement points across the entire journey
We follow every phase — adapted to your business model — and measure both quantitatively and qualitatively.
Three KPIs that lead
Standardised key figures — comparable over time and against external benchmarks.
Concrete — not just an average score
For every insight we deliver:
Every touchpoint scored with a quantitative metric + qualitative quotes.
The top-10 most important improvement areas, ranked by impact on NPS.
Breakdown by physical store, web, app, phone, email — so you can see where the gaps are.
Per identified friction: concrete proposal, owner and time horizon. For implementation.
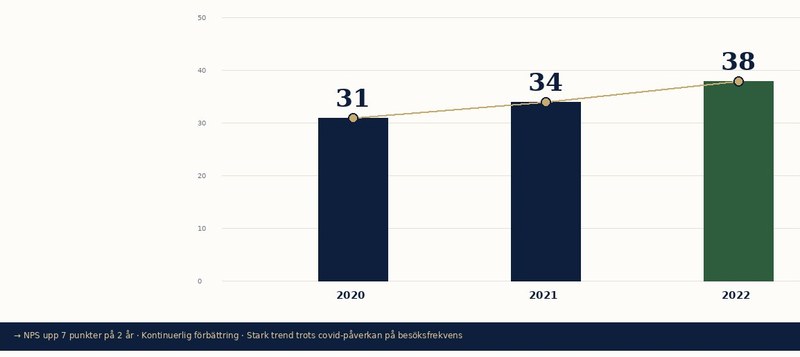
Examples from an actual report
Screenshots from a customer experience study for a B2C coffee chain (anonymised). 1,107 respondents through app + Wi-Fi, 80+ units measured. Delivered with executive summary, NPS trend, per-unit analysis and concrete actions.
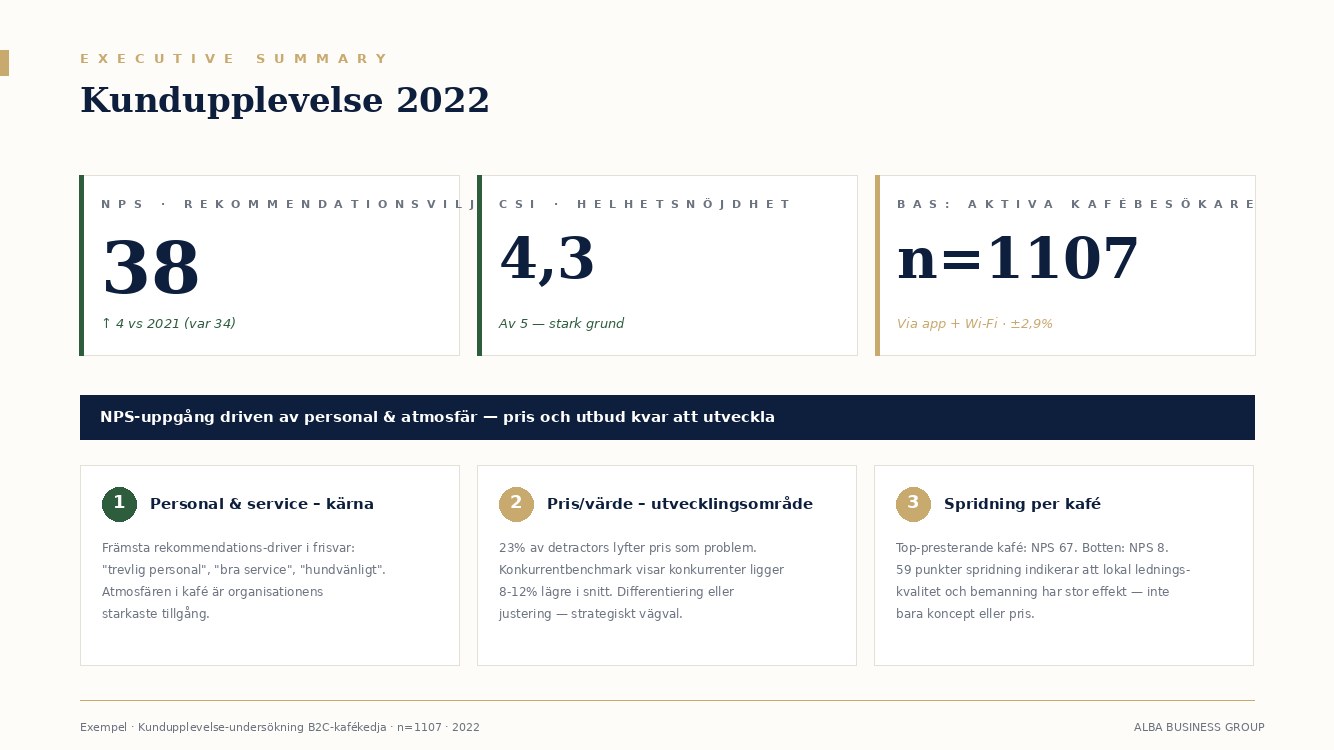
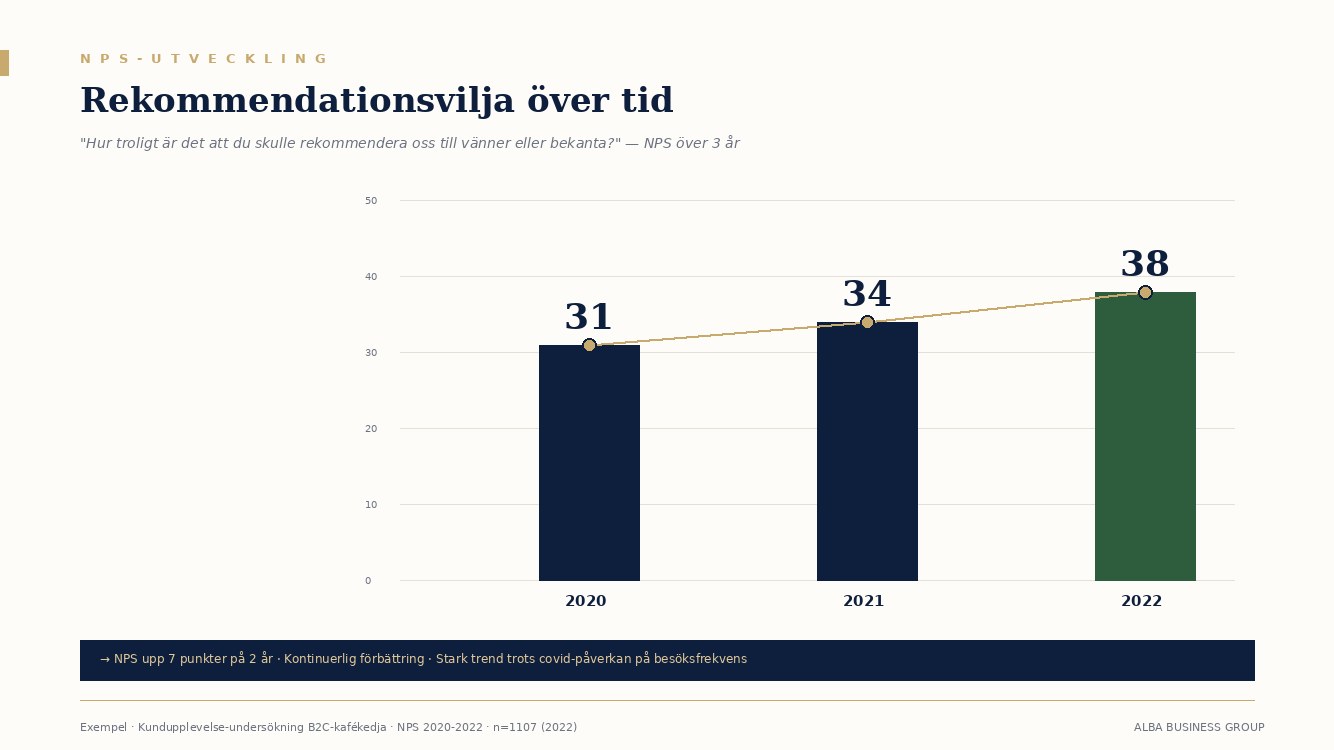
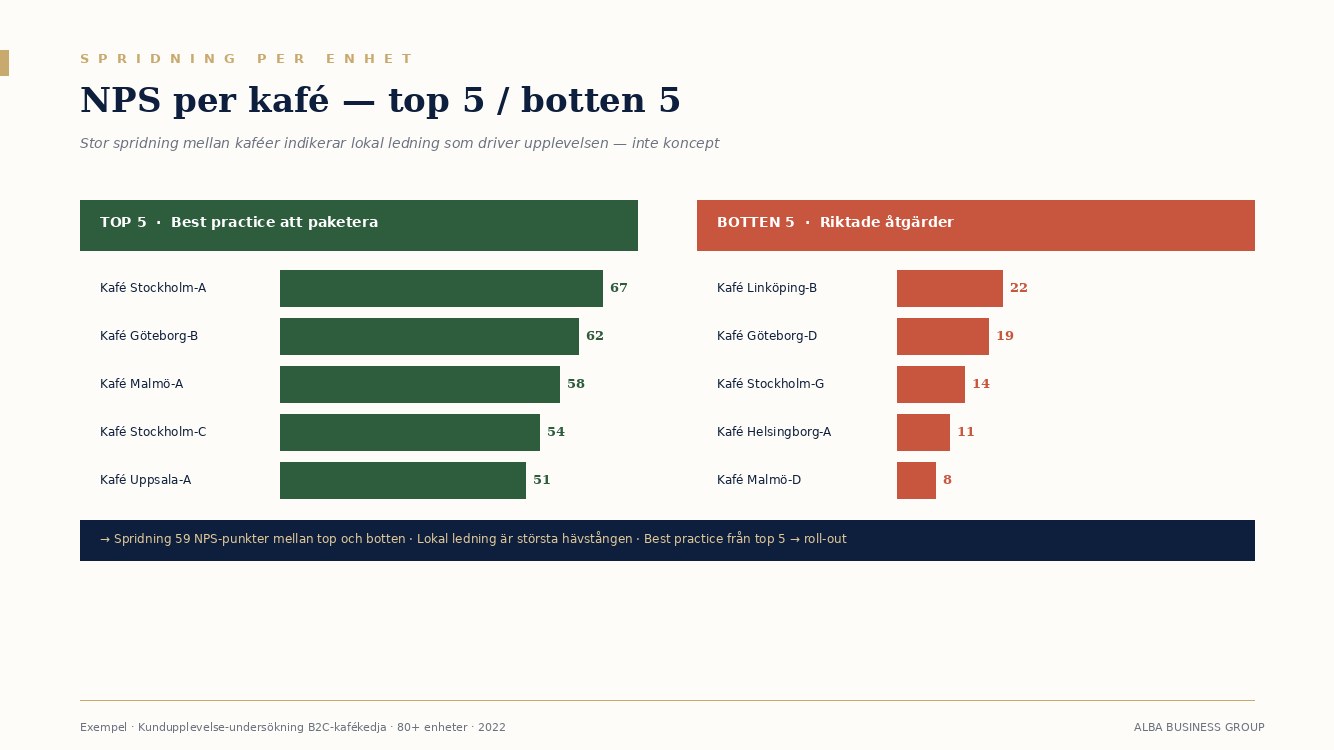
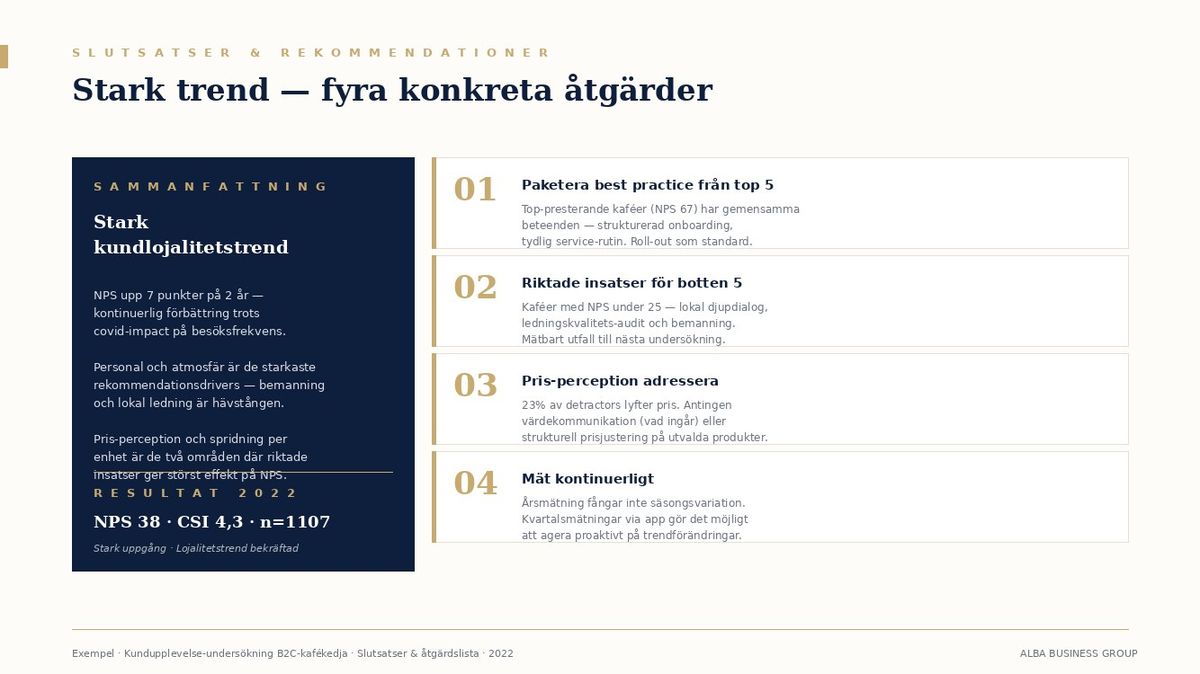
The images are from an actual delivery to a B2C coffee chain in 2022 (n=1,107, 80+ units, NPS follow-up over 3 years). Customer name, brand and respondent data have been removed or masked in the example.

"We thought the problem was the product. The study showed that 70% of the friction was in the in-store greeting — and in the SMS confirmation afterwards. Two changes lifted NPS by 14 points."
Want to know exactly where
the experience clicks — and where it does not?
Book 15 minutes and we will discuss your current customer journey, which touchpoints you want to measure and how we design the study to capture both quantitative and qualitative insight.
15 min · free of charge · no preparation needed