How your brand
is perceived by the consumer.
Measure how your brand is perceived in the eyes of consumers — awareness, image, core values and loyalty. Identify strengths and weaknesses compared with competitors and a foundation for the communication strategy.
Typical ROI on a consumer brand study through correct positioning, campaign choice and channel mix.
Of consumer decisions are driven by emotional factors — and rationalised afterwards. We capture both layers.
For B2C panels with representative distribution across demographics, region and purchase behaviour.
What a positioning analysis looks like
Awareness, image and preference measured against 6 competitors — broken down by demographics and purchase behaviour. This is an actual delivery to a consumer brand (anonymised).
A complete picture
of your brand position
We always start by understanding your business goals — then we choose method and design. The result is not just numbers but concrete action recommendations ranked by expected impact.
Awareness
Spontaneous and aided. Top-of-mind share in the category plus aided awareness against specific competitors. Broken down by demographics, region and purchase behaviour — so you can see where you have coverage and where there are blind spots.
Image & associations
What are you associated with? Which adjectives come to the consumer's mind? Per attribute dimension (quality, price, innovation, sustainability, tradition). Per core value and compared with competitors — to see where you stand out.
Preference & choice
What drives the choice? Driver analysis of rational vs emotional factors. When choosing between your brand and a competitor — what tips the decision? Price, quality perception, trust, value alignment?
Loyalty & recommendation
Do they stay — or switch? Measurement of repurchase frequency, NPS and what lies behind a switch. Identifies loyalty drivers so you can strengthen the relationship with existing customers.
brand guide
for consumer
The complete brand guide for consumer
An 18-minute read written by Johan Asklund. Awareness, image, preference and loyalty — how to design consumer panels that capture both rational and emotional drivers. Question examples and driver analysis templates included.
Read the guide →The consumer purchase journey
— from category awareness to advocacy
B2C consumer brands compete on several layers at the same time. We measure all touchpoints in the consumer's decision process — from first exposure to social media sharing.
Measurement points across the entire journey
We follow every phase — adapted to your business model — and measure both quantitatively and qualitatively.
Three KPIs that lead
Standardised key figures — comparable over time and against external benchmarks.
Concrete — not just an average score
For every insight we deliver:
Your core values and image compared with 5–10 competitors — visualised.
Which factors drive purchase intent most strongly — emotional vs rational.
Breakdown by demographics (age, gender, household) and behaviour (purchase frequency, channel preference).
Why customers leave for competitors — and what would have prevented it.
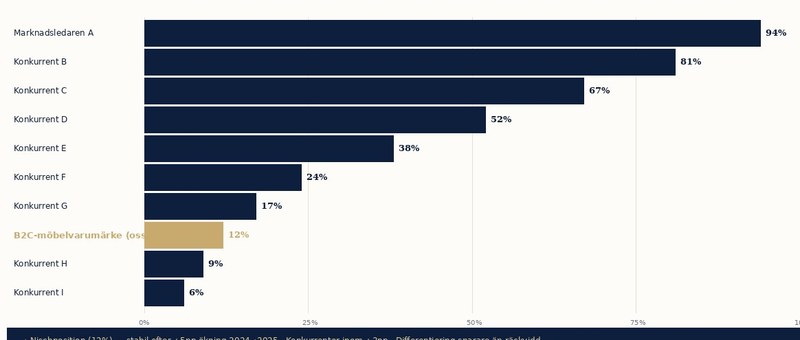
Examples from an actual report
Screenshots from a brand study for a B2C furniture brand (anonymised). 1,000 respondents through a consumer panel, 10 brands compared. Delivered as Word + PDF + PowerPoint with executive summary, competitor mapping, demographic breakdowns and concrete strategic choices.
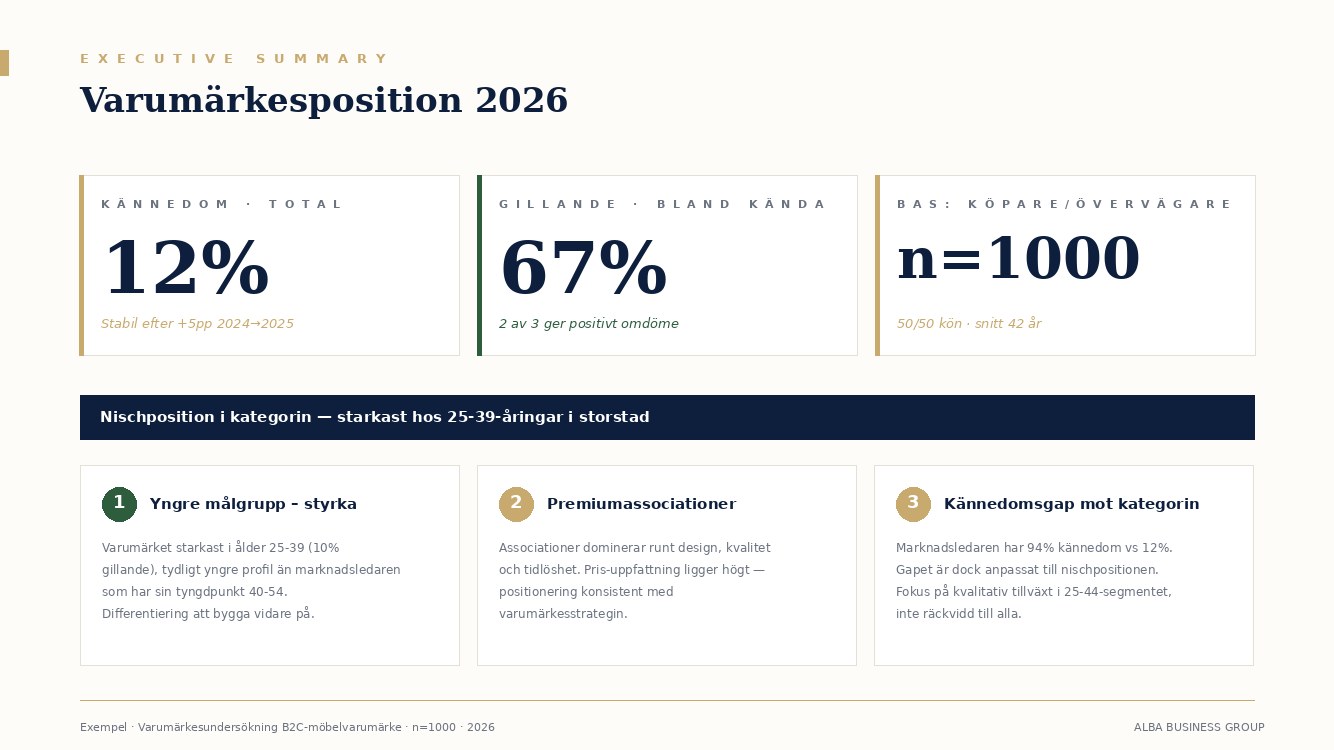
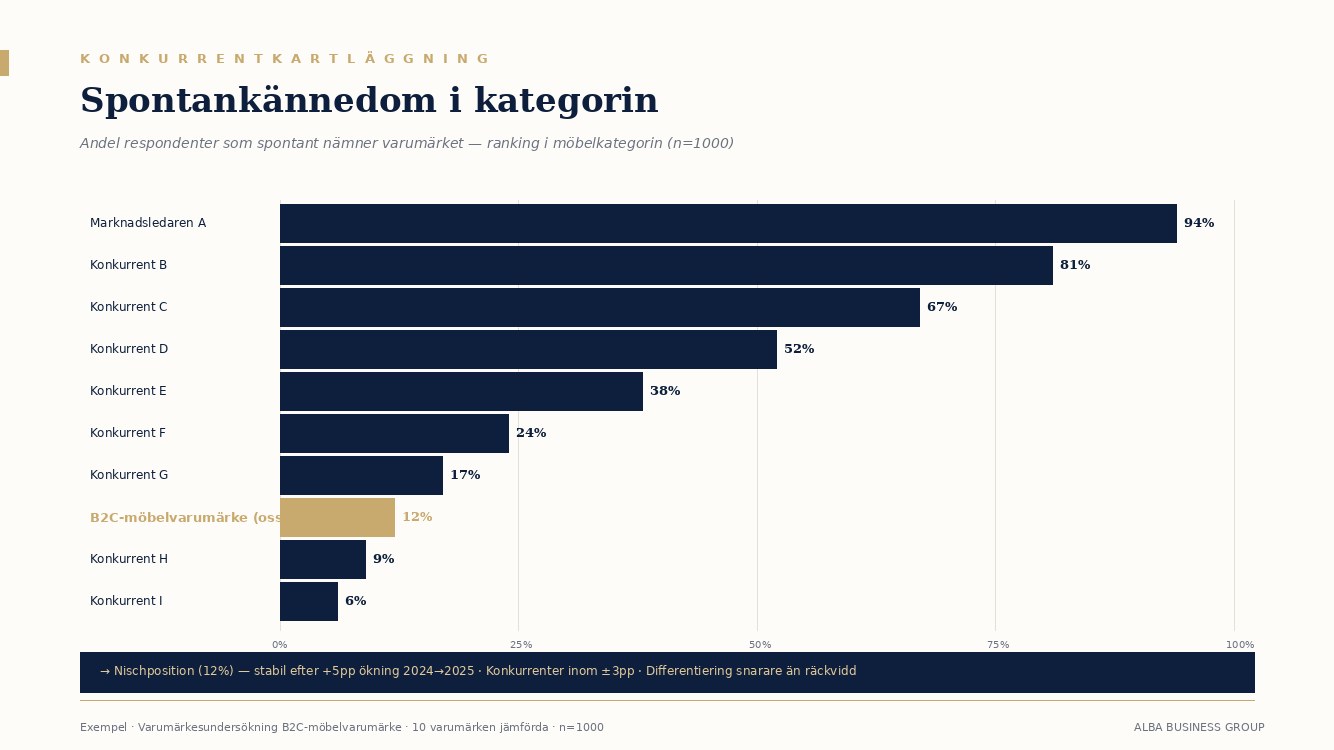
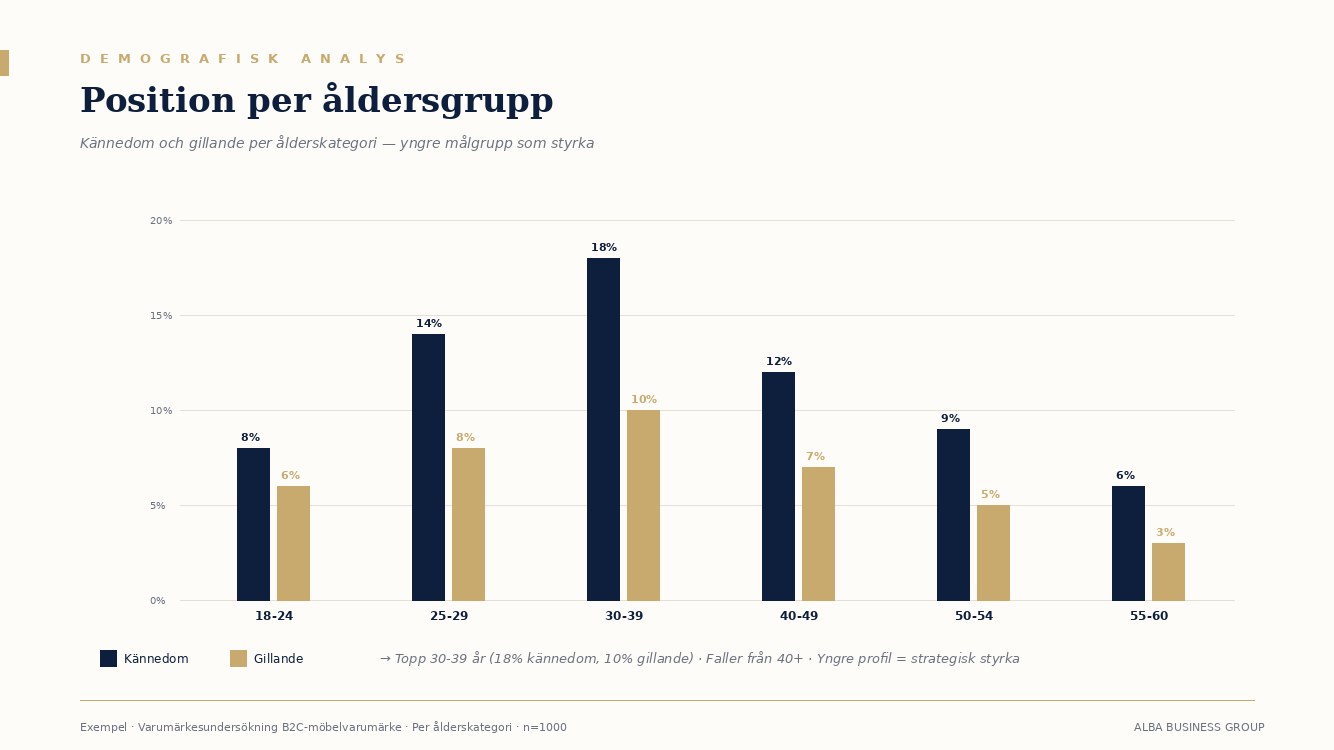
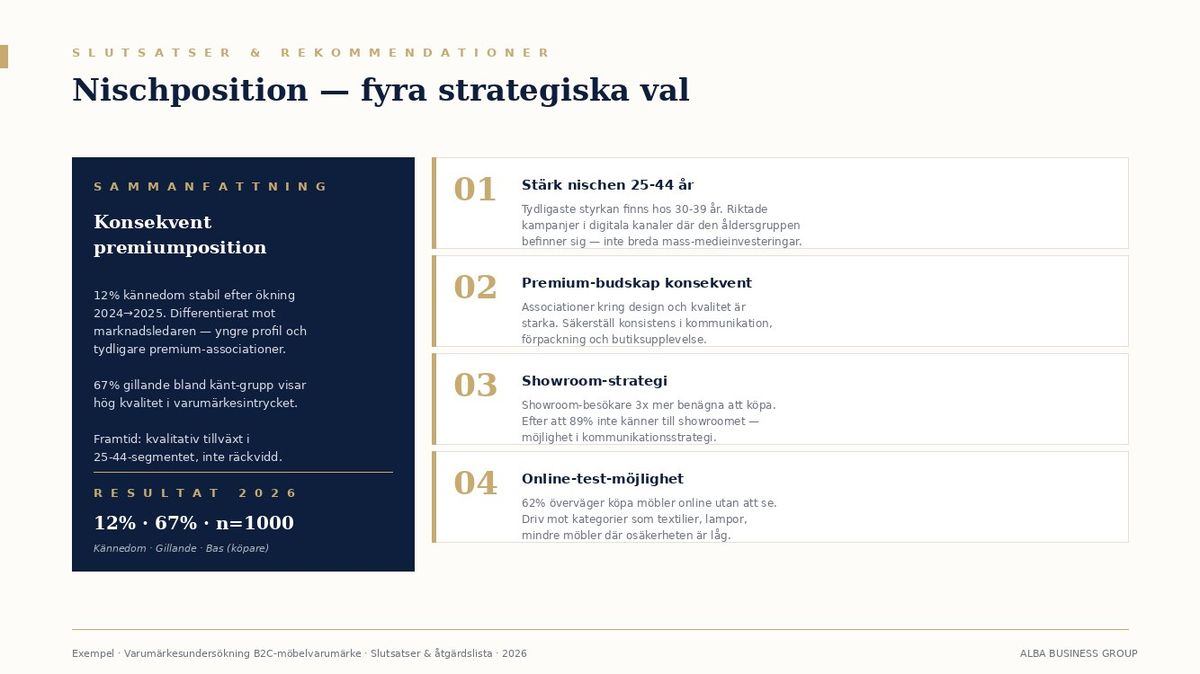
The images are from an actual delivery to a B2C furniture brand in 2026 (n=1,000, 10 brands compared). Customer name, brand and respondent data have been removed or masked in the example.

"We knew we were number two in the category. The study showed we were number one among 25–34 year-olds — the target group we had not been communicating to. The entire media mix was reworked."
Want to know what consumers
actually think about you?
Book 15 minutes and we will discuss your current positioning, your core competitors and how we design the study so you get a basis to act on, not just numbers to report.
15 min · free of charge · no preparation needed